Ecological Health & Function

Flow Regime

CATEGORY: Flow Regime

hydrograph indicator

Hydrograph Indicator

The hydrograph indicator considers the following components of the Yampa River’s flow regime:
Magnitude, timing, and duration of peak flows

Adequate peak flows are essential to river health and function. Snowmelt-driven peak flows during spring runoff are important for numerous watershed services, such as fishery support, riparian habitat quality, sediment flushing, water quality maintenance, recreation, aesthetics, and groundwater connection and recharge.

Magnitude, timing, and duration of base flows
Base flows are the low flows that occur after snowpack melt, during dry season, usually from late summer to early spring. They provide critical support of aquatic habitat and riparian connectivity when the stream needs it most after peak flows have receded. Sources of base flows are rainfall events and slowly percolating groundwater, and they can be augmented by reservoir releases and irrigation return flows in managed systems.
Total annual volume (the amount of water delivered to the riverscape from its contributing watershed) and hydrograph form (the shape of the hydrograph, including timing and duration of rising and falling limbs) are also important components of flow regime in the Yampa River Basin but are not included in the scoring for this indicator due to lack of available modeled data.

Hydrograph score by Section

Upper Yampa Segment

Score coming 2025

Elk River
Segment

Score coming 2026

Lower Yampa
Segment

Score coming 2027

Did You Know?

The flow data used for the Scorecard includes data modeled from streamflow gauges whose periods of record are approximately 40 to 60 years old. It also considers a streamflow trend analysis on the main stem of the Yampa River conducted by USGS over a 100-year time period.

Hydrograph examples are provided below. Example A shows the basic shape of a snowmelt-driven hydrograph, including seasonality of high and low flows. Example B shows the relationship between a typical hydrograph in a snowmelt-driven system and the snowpack itself.
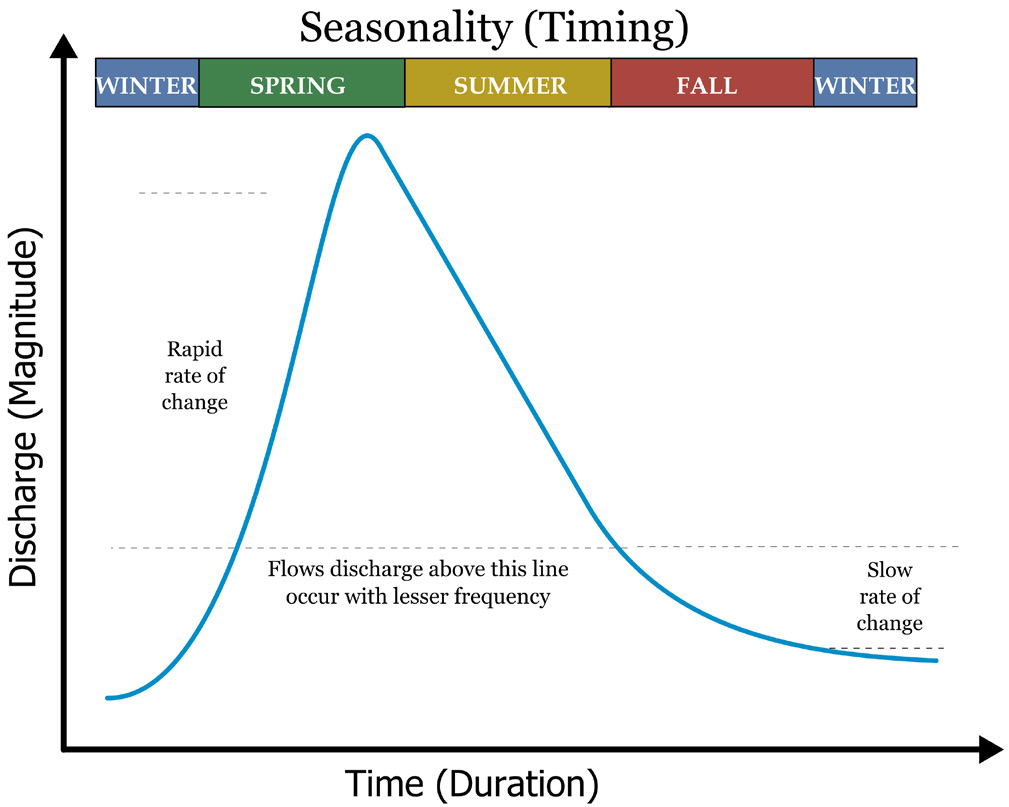
Example A

Credit: CWCB (Colorado Water Plan 2015)
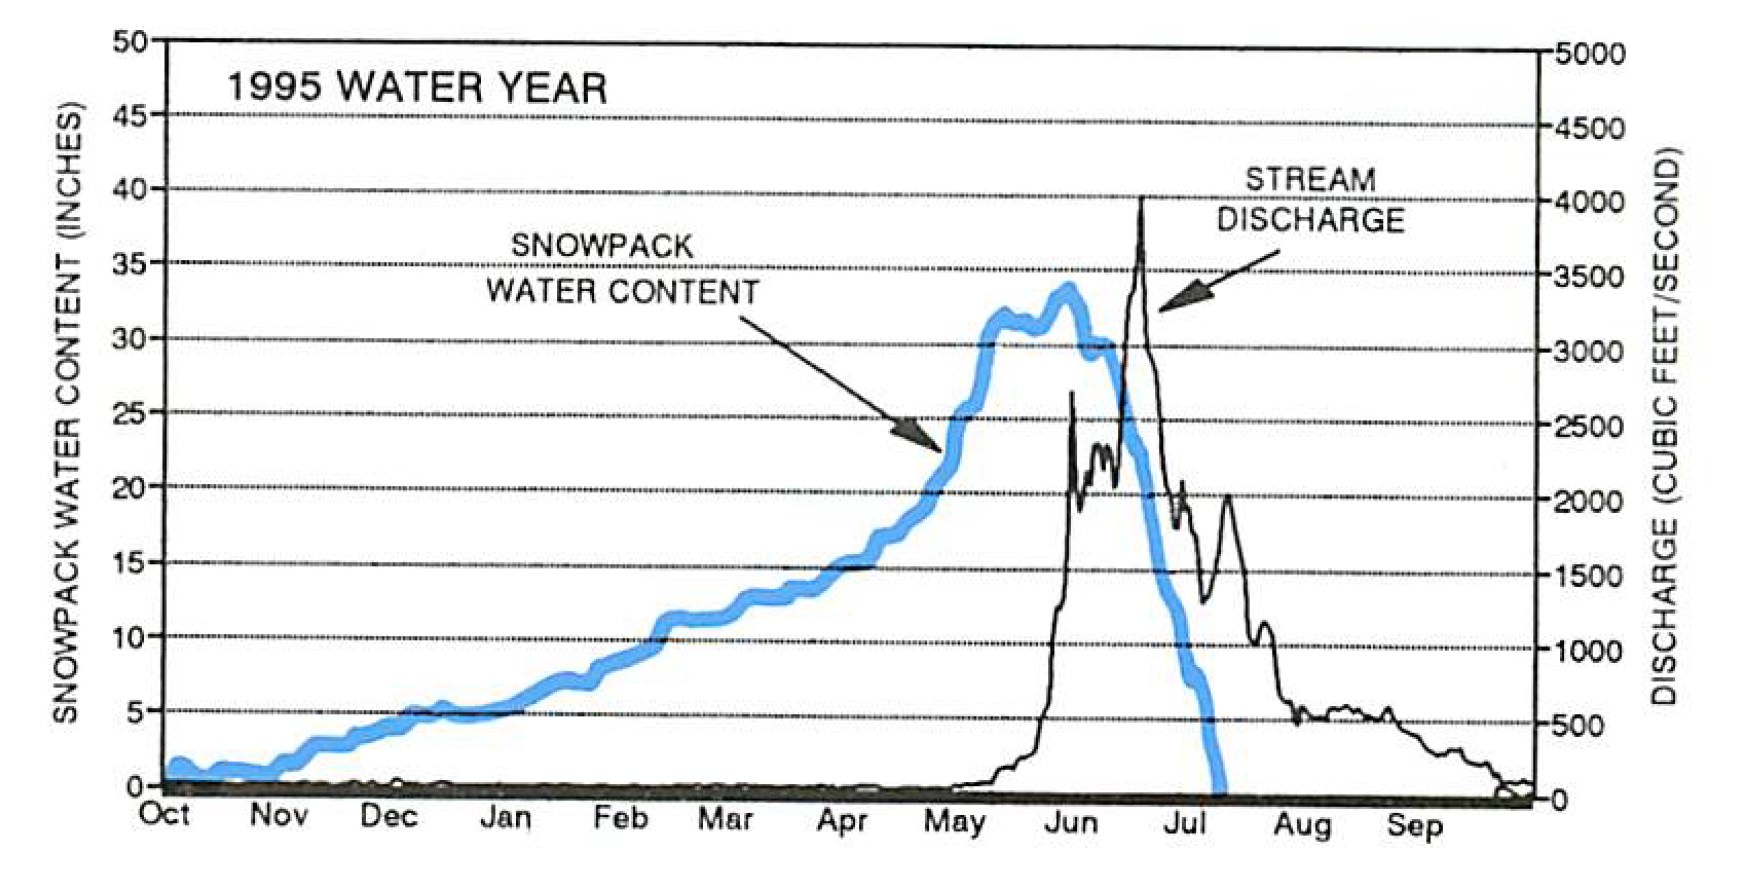
Example B

Credit: Doesken and Judson 1996

What else goes into the scoring?